
Which nations do Polish people like the most?
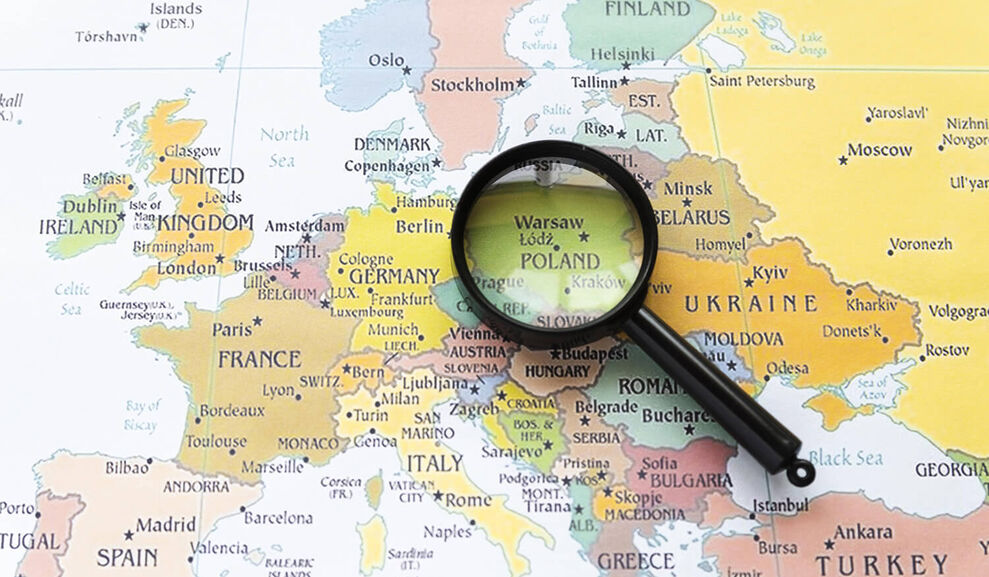
Some countries just seem to get along better than others - often because of shared borders, a common language or history. What other nations do Polish people feel especially connected to? Or to put it simply - what other nations do they like the most?
For almost thirty years, the Polish Public Opinion Research Center (CBOS) has surveyed Polish attitudes towards other nations. This year, the respondents were asked to rate twenty three nations on a 7-point scale, ranging from -3 (“dislike”) to +3 (“like very much”), with 0 meaning “neutral”. Are you curious who had the highest score?
The survey results show that more than half of the respondents express positive feelings towards Poland’s neighbours to the south: citizens of Czechia (53%) and Slovakia (52%). Italians follow close behind, taking third place in the ranking (51%), ahead of Americans (50%), the English (49%) and Hungarians (48%). Around 40% of survey respondents hold positive views of Greek (43%), Swedish (41%), Austrian (40%) and Japanese nationals (40%). The above nations are rarely seen in a negative light by Poles. CBOS survey findings indicate that overall, Polish people tend to display fondness, rather than antipathy, for other countries - on average, the respondents expressed their liking for eight different nationalities. Statistically, the most positive attitudes towards other nations are held by people with higher education, living in big cities, in a good financial standing and more often women than men.
According to the researchers, people’s perceptions of other nations are a product of many factors, such as national stereotypes, historical conditioning, own experiences, current events and political relations between said countries. It has also been observed that Polish people generally tend to show a more positive attitude towards nations with a high standard of living, meaning the ones that serve as a positive reference group for them.
| Nation | Positive attitudes* | |
|---|---|---|
| 1 | Czech Republic | 53% |
| 2 | Slovakia | 52% |
| 3 | Italy | 51% |
| 4 | USA | 50% |
| 5 | England | 49% |
| 6 | Hungary | 48% |
| 7 | Greece | 43% |
| 8 | Sweden | 41% |
| 9 | Austria | 40% |
| 10 | Japan | 40% |
*Note that the respondents used a rating scale, meaning they could also choose a neutral option.


